1. Introduction: The Importance of Speed Management
Speed-related danger is one of the most chronic and harmful issues that face the UK. Whether on residential roads, busy village high streets or in areas of modal competition, inappropriate and excessive speeds result in death and injury collisions, but also cost quality of life, deter active travel and simply aren’t fair – allowing motor traffic to dominate public space to the detriment of all other users.
For those professionals with responsibility for managing public space and public safety – highways engineers, local authority planners, urban designers and more – there is a clear and professional duty to act. Yet despite a growing body of evidence and an increasing urgency to do so, the most common question we are asked is: “How do I put a speed table on?”
The speed table (or plateaux in international French) is one of the most flexible, robust and efficient tools available in the traffic calming toolkit. A raised, flat-topped and full-carriageway-wide plateau, a speed table combines the vertical deflection to physically enforce a reduction in speed with a priority crossing point for pedestrians and cyclists. Less confrontational than a speed hump, the greater plateau length allows for a gentler transition for larger vehicles, while still effectively reducing speed for the majority of traffic. This means a speed table can be used on bus routes and routes with emergency services access, if well designed.
Legally, speed tables are formally defined traffic calming measures under both the Highways Act 1980 and the Traffic Calming Act 1992, meaning they can be implemented as statutory measures where necessary and desirable. They are also the primary engineering approach to achieving compliance with 20mph speed limits, supporting the Safe Systems approach that is the foundation of Vision Zero and helping to deliver the modal shift needed as set out in Local Transport Plans and Active Travel England.
This article offers a detailed technical, legal and practical guide to speed tables for professionals working in the UK. Covering everything from the basics of geometry and materials through the statutory process and scheme evaluation, it is designed to be the one-stop-shop reference for any professional – highways officer, consultant or planner – needing to specify, design, consult on, construct and evaluate a speed table scheme in any location.
2. Speed Tables Defined: Anatomy, Types and Key Differentiators
Before a speed table can be specified or designed correctly, it is essential to agree upon its definition and attributes. A speed table is comprised of 3 separate geometric features – an approach ramp, a plateau and an exit ramp. The plateau section is usually 3 metres to 6 metres long (the former being sufficient for managing the speed of traffic, the latter allowing for a pedestrian crossing movement or a wider flat surface on which wheelchair users or those with mobility issues can rest). The approach ramp and exit ramp are of a gradient no greater than 1 in 10, though 1 in 15 is now generally considered best practice to ensure a more comfortable ride for bus passengers and lower levels of noise and vibration affecting neighbouring properties.
Tables can be constructed in a variety of different materials, dependent on context, cost and visual desire. Asphalt construction is the least expensive and is generally used for standard applications, with the plateau surface finished to the same level as the existing carriageway. Concrete tables are more durable and are well suited to locations where there are significant movements of goods vehicles. The most aesthetically pleasing finish is provided by the use of modular paving systems such as concrete block paving, natural stone setts and proprietary paving systems like Quicksetts, particularly in Conservation Areas, in village centres, and where the speed table is being used as a gateway or to improve the public realm.
The functional distinction between speed tables and other vertical deflection measures is critical to appropriate selection:
| Feature | Speed Table | Speed Hump | Raised Junction |
|---|---|---|---|
| Profile | Long flat plateau (3-6m) | Rounded, parabolic profile | Entire junction raised to footway level |
| Plateau Length | 3-6 metres | Typically <1 metre at apex | Variable, often 10m+ |
| Primary Goal | Speed control + designated pedestrian crossing | Aggressive speed reduction only | Pedestrian priority at junctions |
| Ramp Gradient | 1:10 to 1:15 | 1:10 to 1:12 | 1:10 to 1:20 |
| Typical Use | Mid-block crossings, gateway treatments, school streets | Residential roads, private drives | Side road entries, “continuous footways” |
| Bus Route Suitability | High (with appropriate design) | Low to moderate | High |
| Emergency Vehicle Impact | Minimal delay (<5 seconds) | Moderate delay, discomfort | Minimal delay |
| Pedestrian Function | Formal crossing point with tactile paving | None (incidental only) | Junction-wide priority |
The primary benefit of the speed table over other raised measure is the increased length of its plateau section. For service vehicles, this allows a fire appliance or ambulance to pass over the feature at 20-30mph with limited loss of momentum, rather than having to come to a near complete stop as for a traditional speed hump. For bus companies, it has the benefit of lower vertical acceleration reducing customer comfort issues and the potential danger to standing passengers, making them the only form of vertical deflection that is routinely accepted on Quality Bus Corridors and high frequency routes.
For pedestrians and cyclists, the flat plateau section provides a defined crossing point that can be enhanced through tactile blister paving to national Guidance on the Use of Tactile Paving Surfaces standards, dropped kerbs to a maximum 6mm upstand, and high-visibility road markings, to make the speed table a genuine piece of pedestrian infrastructure, rather than just a speed reduction measure, addressing both the speed and severance functions that underpin the Safe Systems hierarchy.
The following variants of the standard form are in common use:
- Full-width tables: As they cross the full width of the carriageway (typically 5.5-7.5 metres) these have the maximum possible benefit in terms of pedestrian priority and speed reduction.
- Build-out tables: Incorporating kerb build outs or pedestrian refuges to reduce the crossing distance, but still leaving a central traffic lane.
- Sinusoidal profile tables: In which a more gradual, wave-form ramp profile is used, further reducing noise and vibration issues, and is therefore better suited to sites abutting noise sensitive receptors.
- Coloured or textured plateau surface: In which a contrasting surface material (red asphalt, block paving, setts) is used to increase visual prominence, and add to the psychological message of a special zone.
3. The Regulatory Framework: UK Law, Standards, and Design Guidance
Speed tables exist within a comprehensive regulatory framework that governs their design, implementation, and ongoing maintenance. Understanding this framework is not merely an academic exercise but a practical necessity: failure to comply with statutory requirements can render a scheme unlawful, expose the highway authority to legal challenge, and undermine public confidence in the intervention.
Primary Legislation
The Highways Act 1980 establishes the fundamental powers and duties of highway authorities in England and Wales. Section 90A-90I, inserted by the Traffic Calming Act 1992, provides the specific legal basis for the construction of traffic calming works, defined as “works affecting the movement of vehicular or other traffic for the purpose of promoting safety or preserving or improving the environment.” Speed tables fall squarely within this definition, and their installation must comply with the procedural requirements set out in these sections.
Key statutory requirements include:
- Section 90B: The duty to consult with local residents, businesses, and statutory consultees (police, fire, ambulance services) before implementing traffic calming works.
- Section 90C: The requirement to publish notice of proposed works and consider objections.
- Section 90D: The power to make a Traffic Regulation Order (TRO) in conjunction with traffic calming works, typically to impose speed limits or waiting restrictions.
The Road Traffic Regulation Act 1984 governs the making of TROs, which are frequently required alongside speed table schemes to implement or reinforce 20mph speed limits, prohibit waiting on the approach to the table, or designate the plateau as a formal pedestrian crossing.
Design Standards and Guidance
The cornerstone technical document for speed table design is the Department for Transport’s Local Transport Note 1/07: Traffic Calming (LTN 1/07), published in 2007 and remaining the definitive UK guidance. LTN 1/07 provides detailed specifications for:
- Geometric design parameters: Plateau length (minimum 3m for pedestrian crossing function), ramp gradients (maximum 1:10, recommended 1:15), and approach taper lengths.
- Material specifications: Surface course requirements, edge restraint details, and drainage considerations.
- Signing and marking: Requirements for advance warning signs (diagram 557.1), road markings (diagram 1057), and illumination.
- Integration with other measures: Guidance on combining speed tables with build-outs, central refuges, and raised junctions.
Clause 5.4 of LTN 1/07 specifically addresses speed tables, noting that “the flat top allows pedestrians to cross more easily and provides a more comfortable ride for cyclists and bus passengers than a speed hump.” The document recommends a minimum plateau length of 3 metres for pedestrian crossing functionality, extending to 6 metres where the table serves as a formal crossing point on a desire line.
Complementary guidance includes:
- LTN 1/20: Cycle Infrastructure Design (2020): Addresses the integration of speed tables with cycle routes, recommending that tables on cycle routes use the gentlest practicable gradient (ideally 1:20) and avoid abrupt level changes.
- Inclusive Mobility (DfT, 2021 update): Specifies requirements for tactile paving, dropped kerbs (maximum 6mm upstand), and colour contrast to assist visually impaired pedestrians.
- Traffic Signs Manual, Chapter 5: Details the legal requirements for signing and marking of speed tables, including advance warning signs and plateau markings.
British and European Standards
Material and construction quality is governed by a suite of British Standards (BS) and harmonised European Standards (BS EN):
- BS EN 1436: Performance of road markings, specifying retroreflectivity and skid resistance requirements for plateau markings.
- BS 7533: Pavements constructed with clay, natural stone, or concrete pavers, providing specifications for block paving construction including edge restraint and bedding layers.
- BS 8300-1: Design of an accessible and inclusive built environment, addressing tactile paving installation and colour contrast requirements.
Traffic Regulation Orders
In most cases, the installation of a speed table requires the making of a Traffic Regulation Order under the Road Traffic Regulation Act 1984. The TRO serves multiple functions:
- Formalising the speed limit: Where a speed table is installed as part of a 20mph zone or limit, the TRO legally establishes that limit.
- Prohibiting waiting: TROs commonly prohibit waiting within 10 metres of a speed table to maintain sight lines and prevent obstruction of the crossing point.
- Designating the crossing: In some cases, the TRO may designate the speed table plateau as a formal pedestrian crossing, though this is less common than informal crossing status.
The TRO process involves:
- Drafting the Order: Preparation of the legal text and accompanying plans.
- Statutory consultation: A minimum 21-day consultation period during which objections may be lodged.
- Consideration of objections: The highway authority must consider all valid objections and may be required to hold a public inquiry if objections are substantial.
- Making or abandoning the Order: Following consideration of objections, the authority may make the Order (with or without modifications) or abandon the proposal.
The TRO process typically adds 3-6 months to scheme delivery timescales and represents a significant procedural hurdle, particularly where public opposition is anticipated. However, it is a fundamental safeguard ensuring democratic accountability and procedural fairness in the alteration of the highway network.
Liability and Maintenance Obligations
Once constructed, a speed table becomes part of the adopted highway and the highway authority assumes ongoing maintenance liability under Section 41 of the Highways Act 1980 (the duty to maintain the highway). This includes:
- Structural maintenance: Ensuring the table remains in a safe condition, free from defects that could cause injury or vehicle damage.
- Drainage maintenance: Preventing ponding on the plateau surface and ensuring gullies remain clear.
- Signing and marking maintenance: Maintaining advance warning signs and road markings to required standards.
Failure to maintain a speed table to an appropriate standard can result in liability for damage to vehicles or injury to users, making whole-life cost assessment and maintenance planning essential components of scheme appraisal.

4. Strategic Planning and Implementation: A Step-by-Step Process
Successful speed table implementation requires a structured, evidence-based approach that integrates technical design, legal process, community engagement, and quality assurance. The following phased methodology provides a comprehensive project lifecycle framework.
Phase 1: Problem Identification and Option Appraisal
Effective traffic calming begins with robust problem definition. Speed tables should not be implemented as a default response to community pressure but as a targeted intervention addressing specific, evidenced problems.
Data Collection Requirements:
- Speed surveys: Conduct 7-day Automatic Traffic Counter (ATC) surveys to establish 85th percentile speeds, mean speeds, and speed distribution. The 85th percentile speed (the speed at or below which 85% of vehicles travel) is the critical metric: where this exceeds the speed limit by more than 5mph, intervention is typically justified.
- Collision data: Extract 5-year STATS19 collision data for the study area, identifying collision clusters, causation factors (speed-related collisions are coded as contributory factor 405-406), and vulnerable user involvement.
- Traffic volume data: Record vehicle flows by class (cars, LGVs, HGVs, buses, motorcycles) to inform design decisions around ramp gradient and plateau length.
- Community feedback: Conduct resident surveys, school travel surveys, or public meetings to understand perceived safety concerns and desire lines for pedestrian movement.
Option Appraisal:
Having established the evidence base, conduct a structured option appraisal considering:
- Do-nothing baseline: What are the consequences of no intervention?
- Non-physical measures: Could enhanced enforcement, Vehicle Activated Signs (VAS), or community speed watch programmes address the problem?
- Alternative physical measures: Would speed humps, chicanes, or road narrowing be more appropriate?
- Speed table variants: If a speed table is appropriate, what configuration (full-width, build-out, sinusoidal profile) best suits the context?
The option appraisal should employ a multi-criteria assessment framework scoring options against:
- Safety effectiveness: Predicted collision reduction based on evidence from similar schemes.
- Speed reduction: Expected reduction in 85th percentile speed.
- Accessibility: Impact on pedestrians, cyclists, and mobility-impaired users.
- Public transport: Impact on bus journey times and passenger comfort.
- Emergency services: Impact on response times and vehicle wear.
- Cost: Capital cost, whole-life cost, and cost-benefit ratio.
- Public acceptability: Likely level of public support or opposition.
Phase 2: Detailed Design and Specification
Having selected a speed table as the preferred option, detailed design translates strategic intent into buildable specification.
Location Selection:
The precise location of a speed table is critical to its effectiveness and acceptability:
- Pedestrian desire lines: Position the table to intercept established or desired pedestrian crossing movements, particularly routes to schools, shops, or public transport stops.
- Visibility: Ensure adequate forward visibility (minimum 40 metres for a 20mph approach speed, 60 metres for 30mph) and avoid locations immediately beyond bends or crests.
- Drainage: Avoid locations where the table would obstruct surface water flow or create ponding. Where drainage is constrained, incorporate gullies within the plateau or immediately upstream.
- Utilities: Conduct a utility search (C2 level) to identify underground services. Avoid locating ramps directly over major services (gas mains, high-voltage cables) where possible.
- Property access: Maintain adequate clearance from vehicle crossovers (minimum 2 metres) to avoid creating steep gradients at property accesses.
Geometric Design:
Detailed geometric design parameters include:
- Plateau length: 3 metres minimum for basic speed reduction; 6 metres for formal pedestrian crossing function; up to 10 metres for gateway features or where the table incorporates a central refuge.
- Plateau width: Full carriageway width (typically 5.5-7.5 metres) for maximum effect, or reduced width with build-outs where carriageway narrowing is desired.
- Ramp gradient: 1:15 (6.67%) is optimal for bus routes and emergency access; 1:12 (8.33%) is acceptable for lower-frequency routes; 1:10 (10%) is the maximum permissible gradient.
- Ramp length: Calculated from plateau height (typically 75-100mm) and chosen gradient. For a 75mm table at 1:15 gradient, ramp length is 1.125 metres.
- Plateau height: 75mm is standard for 20mph zones; 100mm may be used for more aggressive speed reduction but increases discomfort for larger vehicles.
Material Specification:
Material selection balances cost, durability, aesthetics, and maintenance:
- Asphalt construction: Most economical option. Specify 60mm surface course to BS 594987 (Hot Rolled Asphalt or Stone Mastic Asphalt) over 100mm binder course and appropriate sub-base. Plateau surface should match existing carriageway or use coloured asphalt (typically red) for visual prominence.
- Concrete construction: Specify C32/40 concrete to BS 8500, minimum 150mm thickness, with brushed finish for skid resistance. Incorporate movement joints at 3-metre centres.
- Block paving: Specify 80mm concrete block pavers to BS EN 1338, laid on 30-50mm sharp sand bedding over Type 1 sub-base. Edge restraint is critical: use concrete haunching or proprietary edge restraints to BS 7533-3. Block paving offers excellent aesthetics and ease of utility access but requires higher maintenance.
- Natural stone setts: Granite or sandstone setts (typically 100x100mm or 200x100mm) provide the highest quality finish for heritage contexts. Specify to BS EN 1342, laid on concrete bed with mortar joints. Significantly higher cost but exceptional durability and aesthetic value.
- Quicksetts system: A proprietary modular paving system designed for rapid installation, combining the aesthetic of traditional setts with modern construction efficiency. Quicksetts use pre-assembled panels of concrete or natural stone setts bonded to a geotextile backing, allowing installation in hours rather than days. Particularly suited to schemes requiring minimal traffic disruption or phased construction.
Drainage Integration:
Speed tables interrupt the natural longitudinal fall of the carriageway, requiring careful drainage design:
- Upstream gullies: Install gullies immediately upstream of the approach ramp to prevent water flowing onto the plateau.
- Plateau drainage: For plateau lengths exceeding 6 metres, incorporate gullies within the plateau surface or at the plateau edges.
- Crossfall maintenance: Maintain a minimum 2.5% crossfall across the plateau to prevent ponding.
Pedestrian Infrastructure:
Where the speed table serves a pedestrian crossing function, integrate:
- Tactile paving: Install blister tactile paving to Guidance on the Use of Tactile Paving Surfaces, 800mm depth, in buff colour for controlled crossings or red for uncontrolled crossings.
- Dropped kerbs: Reduce kerb upstand to maximum 6mm at crossing points, with a minimum 1.2-metre width.
- Colour contrast: Ensure adequate luminance contrast (minimum 30-point difference) between plateau surface and approach carriageway to assist visually impaired users.
Signing and Marking:
Comply with Traffic Signs Manual Chapter 5 requirements:
- Advance warning signs: Diagram 557.1 (speed hump symbol) with supplementary plate indicating “Speed table” or “Raised crossing”, positioned 50-100 metres in advance.
- Plateau markings: White transverse lines (diagram 1057) at the start and end of the plateau, or full-width ladder markings for formal crossing points.
- Illumination: Ensure adequate street lighting (minimum 5 lux average illuminance) at the crossing point.
Phase 3: Legal Process and Community Engagement
The legal and consultation process is often the most challenging and time-consuming phase of implementation.
Traffic Regulation Order Process:
- Draft the Order: Prepare the legal text describing the speed limit, waiting restrictions, or other regulatory provisions, accompanied by a scaled plan showing the extent of the Order.
- Statutory consultation: Publish notice of the proposed Order in a local newspaper and the London Gazette (for England), erect site notices, and notify statutory consultees (police, fire, ambulance, bus operators, freight associations, cycling and pedestrian groups).
- 21-day objection period: Allow a minimum 21 days for objections to be lodged.
- Consider objections: Review all objections, prepare a report for the decision-maker (typically a Cabinet Member or Committee), and recommend whether to make, modify, or abandon the Order.
- Make the Order: If approved, make the Order, publish notice of making, and allow 6 weeks for legal challenge.
Community Engagement Strategy:
Effective community engagement can transform a contentious scheme into a supported intervention:
- Early engagement: Conduct pre-consultation engagement (e.g., drop-in sessions, online surveys) before formal TRO consultation to identify concerns and refine the design.
- Data-driven communication: Present speed and collision data in accessible formats (infographics, maps) to demonstrate the evidence base for intervention.
- Address concerns proactively: Prepare Frequently Asked Questions addressing common objections (emergency access, noise, property values) with factual responses.
- Visualisation: Use photomontages or 3D visualisations to help residents understand the proposed appearance, particularly where high-quality materials are proposed.
- Targeted engagement: Conduct specific engagement with affected groups (residents immediately adjacent to the table, school communities, disability groups) to understand and address their specific concerns.
Managing Objections:
Common objections and evidence-based responses include:
- “Speed tables will delay emergency vehicles”: Present evidence from fire and ambulance services that properly designed tables (1:15 gradient, 75mm height) cause minimal delay (<5 seconds) and are preferable to collision-related road closures.
- “Speed tables cause noise and vibration”: Specify low-profile designs (75mm height, 1:15 gradient) and high-quality materials (block paving or Quicksetts rather than asphalt) to minimise impact. Offer to conduct post-implementation noise monitoring.
- “Speed tables will displace traffic to other roads”: Argue for area-wide schemes rather than isolated interventions, and present evidence that speed reduction measures typically reduce traffic volumes by making alternative routes (walking, cycling) more attractive.
- “Speed tables will reduce property values”: Present evidence from academic studies (e.g., Greaves et al., 2008) showing that traffic calming typically increases property values by improving environmental quality.
Phase 4: Construction and Quality Assurance
Construction quality determines long-term performance and public perception.
Traffic Management:
Speed table construction typically requires full carriageway closure or single-lane working with temporary traffic signals. Key considerations:
- Advance notification: Notify residents, businesses, and emergency services at least 7 days in advance.
- Phased construction: For schemes involving multiple tables, phase construction to minimise disruption and allow traffic to use alternative routes.
- Out-of-hours working: Consider night or weekend working for high-traffic locations, though this increases cost and may cause noise disturbance.
Construction Sequence:
- Excavation: Excavate the existing carriageway to formation level, typically 300-400mm depth depending on sub-base thickness.
- Sub-base construction: Lay and compact Type 1 sub-base in layers not exceeding 150mm, achieving minimum 95% maximum dry density.
- Binder course: Lay asphalt binder course (typically 100mm) or concrete base (150mm), ensuring correct longitudinal and crossfall profiles.
- Surface course: Lay final surface (asphalt, block paving, or setts) to specification, ensuring correct levels and surface regularity.
- Tactile paving and kerbs: Install dropped kerbs and tactile paving to correct levels and alignment.
- Road markings: Apply thermoplastic road markings to BS EN 1436 standards.
- Signing: Install advance warning signs and any associated street furniture.
Quality Assurance:
Implement a rigorous quality assurance regime:
- Level checks: Verify plateau levels, ramp gradients, and crossfalls using digital level or total station, ensuring compliance with design tolerances (±10mm for levels, ±0.5% for gradients).
- Material testing: Conduct compaction testing (nuclear density gauge or plate bearing test) on sub-base and binder course layers.
- Surface regularity: Measure surface regularity using a 3-metre straight edge, ensuring deviations do not exceed 6mm.
- Tactile paving installation: Verify tactile paving orientation, depth, and colour contrast.
- Signing and marking: Verify sign positions, heights, and retroreflectivity; verify road marking dimensions and retroreflectivity.
Snagging and Handover:
Conduct a formal snagging inspection before handover, addressing:
- Surface defects (depressions, irregularities, material defects)
- Drainage functionality (test gullies, check for ponding)
- Signing and marking defects
- Landscaping and reinstatement of verges or footways
Issue a completion certificate and commence the defects liability period (typically 12 months), during which the contractor remains responsible for remedying defects.
Phase 5: Post-Implementation Monitoring and Evaluation
Monitoring and evaluation are essential to demonstrate scheme effectiveness, inform future schemes, and justify continued investment.
Monitoring Programme:
Conduct before-and-after studies measuring:
- Speed reduction: Repeat 7-day ATC surveys at the same locations as baseline surveys, comparing 85th percentile speeds, mean speeds, and speed distributions. Effective speed tables typically reduce 85th percentile speeds by 5-10mph.
- Collision reduction: Monitor STATS19 collision data for 3-5 years post-implementation, comparing collision frequency and severity with the baseline period. Apply statistical tests (e.g., chi-squared test) to determine whether observed reductions are statistically significant.
- Pedestrian behaviour: Conduct pedestrian crossing surveys, measuring crossing volumes, crossing locations (whether pedestrians use the table or cross elsewhere), and perceived safety (through intercept surveys).
- User perceptions: Conduct resident surveys measuring satisfaction with the scheme, perceived safety improvements, and any negative impacts (noise, vibration, visual intrusion).
Economic Evaluation:
Calculate the benefit-cost ratio (BCR) using DfT’s WebTAG methodology:
- Benefits: Collision cost savings (using DfT’s Value of Prevention of Accidents figures: £2.29m per fatal casualty, £229,000 per serious injury, £23,000 per slight injury, 2023 values), journey time savings for pedestrians and cyclists, health benefits from increased active travel.
- Costs: Capital cost (design, TRO, construction), maintenance cost (annualised over 20-year appraisal period), traffic delay costs (typically negligible for speed tables).
A BCR exceeding 2.0 represents “high value for money” in DfT terms; speed table schemes typically achieve BCRs of 3-10 where collision problems are significant.
Reporting and Dissemination:
Prepare a post-implementation evaluation report documenting:
- Scheme objectives and design rationale
- Baseline conditions and problem definition
- Design and construction details
- Monitoring results and statistical analysis
- Economic evaluation and BCR
- Lessons learned and recommendations for future schemes
Disseminate findings through:
- Local authority committee reports
- Professional publications (e.g., Highways Magazine, Local Transport Today)
- Conference presentations (e.g., CIHT annual conference)
- Case study submissions to national databases (e.g., DfT’s Traffic Calming Case Studies)
5. Advanced Applications and Context-Sensitive Design
Beyond their standard application as mid-block speed reduction and crossing points, speed tables can be adapted to serve more sophisticated functions within the urban design palette.
School Streets and Star Crossings
The school run represents one of the most challenging traffic management scenarios: high pedestrian volumes, including vulnerable children, coinciding with peak traffic flows and time-pressured drivers. Speed tables form the core infrastructure of effective School Streets schemes.
A Star Crossing—a Puffin crossing (pedestrian-actuated signal-controlled crossing) constructed on a speed table—combines the physical speed reduction and level crossing surface of the table with the regulatory priority of a signal-controlled crossing. This hybrid approach delivers:
- Absolute priority: Unlike an informal crossing on a standard speed table, the Star Crossing provides legal priority to pedestrians when the signal is red.
- Enhanced visibility: The raised plateau increases pedestrian visibility to approaching drivers.
- Reduced signal delay: The speed table pre-reduces vehicle speeds, allowing shorter signal phases and reduced pedestrian waiting times.
Design considerations for School Street speed tables include:
- Wider plateaus: Specify 8-10 metre plateau lengths to accommodate high pedestrian flows and allow children to cross in groups.
- Enhanced materials: Use high-quality, colourful materials (coloured block paving, decorative setts) to create a distinctive, child-friendly environment.
- Integration with School Street closures: Where the street is closed to through traffic during school hours, the speed table serves as a physical gateway reinforcing the closure.
Gateway Treatments
Speed tables are highly effective as gateway features marking entry to a village, 20mph zone, or residential area. The physical deflection, combined with distinctive materials and signage, creates a multi-sensory signal to drivers that they are entering a different environment requiring different behaviour.
Effective gateway speed tables incorporate:
- Landmark materials: Natural stone setts, cobbles, or high-quality block paving in contrasting colours create visual impact and a sense of place.
- Extended plateaus: 10-15 metre plateaus create a substantial “threshold” zone.
- Integrated signage: Village name signs, 20mph roundels, or “Welcome to…” signs mounted on the approach to the table.
- Landscaping: Planting, street trees, or public art integrated with the table to create a sense of arrival.
- Lighting: Feature lighting (e.g., illuminated bollards, decorative street lighting) enhances the gateway effect and improves night-time visibility.
Case study evidence demonstrates that gateway speed tables are particularly effective at reducing speeds on rural roads entering villages, where the transition from national speed limit (60mph) to 30mph or 20mph is abrupt and often poorly observed.
Bus Stop Boarders
A bus stop boarder is a raised platform extending the footway into the carriageway at a bus stop, allowing level boarding for passengers with mobility impairments, wheelchairs, and pushchairs. When combined with a speed table, the bus stop boarder creates a seamless, accessible public transport interchange.
Design requirements include:
- Platform height: 140mm above carriageway level (matching low-floor bus entrance height).
- Platform length: Minimum 15 metres to accommodate a 12-metre bus.
- Platform width: Minimum 2 metres, ideally 3 metres to accommodate waiting passengers and boarding movements.
- Approach table: A speed table on the approach to the bus stop pre-reduces vehicle speeds and creates a level surface for the bus to pull alongside the boarder.
- Drainage: Critical to prevent ponding on the platform; incorporate linear drainage at the platform edge.
Bus stop boarders with integrated speed tables are increasingly specified on Quality Bus Corridors and in town centre regeneration schemes, delivering significant accessibility improvements and supporting modal shift to public transport.
Continuous Footways and Raised Side Road Entries
The concept of the continuous footway—where the footway continues across a side road entry at footway level, with the side road ramping up and down—represents a paradigm shift in street hierarchy, prioritising pedestrians over motor traffic. Speed tables provide the engineering solution for continuous footways.
At a raised side road entry, the main road footway continues at its existing level (typically 125mm above carriageway), and the side road ramps up to meet it, creating a raised junction. Vehicles entering or leaving the side road must traverse the ramps, physically reinforcing the priority of pedestrians on the main footway.
Design considerations include:
- Ramp gradients: 1:15 to 1:20 to accommodate all vehicle types, including refuse vehicles and delivery lorries.
- Plateau width: The full width of the side road, typically 4-6 metres.
- Tactile paving: Blister tactile paving at the footway edge to warn visually impaired pedestrians of the vehicle crossing point.
- Colour contrast: Contrasting materials (e.g., block paving on the raised junction, asphalt on the approach roads) to delineate the pedestrian priority zone.
Continuous footways are a core element of LTN 1/20 (Cycle Infrastructure Design) and are increasingly specified in Low Traffic Neighbourhoods, town centre pedestrianisation schemes, and residential estate roads.
6. Look is As Important as Feel: Transforming Speed Tables from Traffic Calming to Place-Making Features
The effectiveness of a speed table is clear – but so is the value of aesthetics. A well-designed, high-quality speed table positively contributes to the public realm and place-making, whilst a cheap and shoddy one does the opposite. The public’s perception of a speed table is intrinsically linked to the acceptability of the scheme – in short, if the design quality is perceived as positive, the outcome will likely be too.
A speed table constructed using standard asphalt construction is low cost, but provides a bare minimum of visual quality. The colour (grey), surface texture (smooth), and presence of joints and patches all reinforce the notion of a functional, traffic-engineering response to a local traffic calming request.
Replacing the asphalt with high-quality materials such as natural stone setts, decorative block paving or cobbled surfaces elevates speed tables to a piece of public realm infrastructure that can complement and enhance the streetscape.
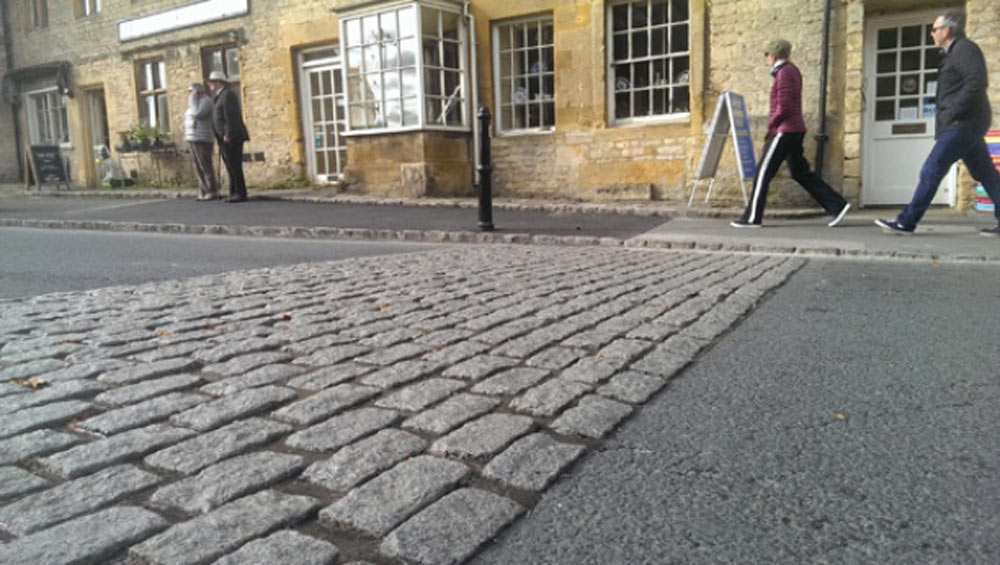
Cobbled speed tables are particularly appropriate in a heritage setting, Conservation Areas, and village centres. Setts of traditional granite or sandstone, laid in a coursed or random pattern, creates a visual connection to the historic street surface whilst providing a modern traffic calming function. The feel and sound of a vehicle passing over cobbles also reinforces the message that this is a special place in the highway requiring a different driving behaviour in terms of speed and concentration.
Benefits of cobbled or high-quality paved speed tables include:
* Visual integration: The natural materials blend with historic buildings, traditional street furniture and existing paving, rather than a visual ‘invasion’ of asphalt.
* Sense of place: The use of distinctive materials can create a local identity, and a ‘sense of arrival’ when entering the site from a gateway location.
* Durability: Setts have a design life of over 100 years, significantly higher than asphalt (20-30 years) or concrete block paving (40-60 years).
* Access for maintenance: Sett paving can be lifted and relaid to access underground services without leaving a scar in the road surface, in contrast to asphalt which needs to be cut through and patched to enable access.
* Noise characteristics: Cobbles are prone to tyre noise, which may be considered either a positive or negative. The noise can be seen as a positive, because it is a reminder for the driver that they need to reduce speed. The noise is also a signal to pedestrians, cyclists, and horse riders that a vehicle is approaching. Modern installation techniques (fine sand jointing, precise level control) can minimise excessive noise.
Quicksetts: Aesthetic Appeal with Rapid Installation
The time and skill required to install traditional sett paving has long been a barrier to its widespread use. Hand-laying granite setts is a specialist craft, and requires skilled paving gangs and long construction periods (typically 3-5 days for a single speed table). This results in prolonged traffic disruption, higher labour costs and reduced contractor availability.
Quicksetts is a proprietary modular paving system that enables the speed, quality and appearance benefits of sett paving to be delivered with installation efficiencies similar to block paving or asphalt. The setts are pre-assembled into panels bonded to a geotextile or polymer backing, and the panels (typically 1m x 1m or 1m x 0.5m) are manufactured off-site with setts accurately positioned and bonded, ready to be delivered to site and rapidly installed.
Quicksetts Installation process:
1. Prepare a concrete base (C32/40, 150mm thickness) or asphalt base (100mm binder course + 60mm surface course) to the required profile and levels.
2. Apply a polymer modified adhesive or mortar bed to the base.
3. Position Quicksetts panels onto the adhesive bed, ensuring correct alignment and level.
4. Fill joints between panels and between individual setts with fine kiln dried sand or resin bound jointing compound.
5. Compact the surface using a vibrating plate compactor to seat the panels and consolidate the jointing material.
Installation time: A typical speed table (6m x 6m plateau) can be installed in 4-6 hours using Quicksetts compared to 3-5 days using traditional hand laid setts. This massive reduction in construction time means:
* Reduced traffic disruption: Shorter road closures reduce inconvenience to residents and businesses.
* Lower traffic management costs: Less need for temporary traffic signals or diversion signs.
* Faster scheme delivery: Multiple speed tables can be installed in a single week, instead of requiring months of phased construction.
* Reduced weather risk: Shorter construction windows reduce the risk of weather delays.
Aesthetic quality: Modern Quicksetts systems are able to achieve similar levels of aesthetic quality to traditional hand-laid setts. Panels are available in a range of materials (concrete setts, natural granite, sandstone or basalt) and laying patterns (coursed, random or herringbone). The pre-assembly process in the factory ensures consistent joint widths and precise alignment are achieved which are often better than can be achieved by hand-laying on site.
Cost considerations: Quicksetts is typically 20-30% more expensive than traditional hand-laid setts on a materials supply cost basis, but the reduced labour and traffic management costs often result in a similar or lower overall scheme cost. For a local authority working within tight budgets and under pressure to minimise disruption, Quicksetts represents an ideal balance of quality, cost and deliverability.
Design principles for aesthetic speed tables
Some design principles for speed tables to maximise aesthetic and place-making value include:
1. Select materials to suit the context: Natural stone in Conservation Areas and historic villages; high-quality concrete block paving in modern residential areas; coloured asphalt or resin-bound surfacing in modern urban settings.
2. Colour and texture contrast: Ensure the plateau surface contrasts with the approach carriageway to increase visibility and add visual interest, without creating too much contrast that is visually cluttering.
3. Pattern and detail: Use laying patterns (herringbone, basketweave, radial) to add visual interest and reinforce the geometry of the crossing point.
4. Edge definition: Use contrasting kerbs, setts or block edging to define the plateau edges and create a crisp, finished look.
5. Coordination with street furniture: Coordinate the speed table design with street lighting, seating, planting and signage to create a unified public realm scheme.
6. Plan for maintenance: Specify materials and construction details that will be easy to maintain and access in the long-term (avoid designs that will deteriorate quickly or be hard to repair).
Case study: Market town gateway speed table
A market town in the East Midlands implemented a gateway speed table at the entrance to the historic town centre, replacing a standard asphalt speed hump that had been installed some years previously and widely criticised as being visually intrusive and dominating the site. The new design featured:
* Materials: Reclaimed Yorkshire stone setts (200mm x 100mm) laid in a coursed pattern, using Quicksetts panels for the main plateau area and hand laid setts for the tapered edges.
* Dimensions: 12-metre plateau length, 6.5-metre width, 75mm height, 1:15 ramp gradients.
* Integration: Co-ordinated with new street lighting (heritage-style columns with LED lanterns), a village name sign and planting beds at the plateau edges.
* Installation: Quicksetts panels enabled the main plateau to be installed in a single day, with hand-laid edge details added over the next two days. Total road closure: 3 days.
7. Cost-Benefit Analysis, Funding, and Overcoming Common Challenges
Cost Breakdown
Understanding the full cost of a speed table scheme is essential for budget planning and funding applications. Typical costs for a single speed table (6m plateau, full-width, asphalt construction) in 2025 prices:
| Cost Element | Typical Cost (£) | Notes |
|---|---|---|
| Design and surveys | £2,000 – £5,000 | Topographic survey, utility searches, design drawings, safety audit |
| Traffic Regulation Order | £3,000 – £8,000 | Legal drafting, consultation, advertising, objection handling |
| Traffic management | £2,000 – £5,000 | Temporary traffic signals or road closure, signage, barriers |
| Construction (asphalt) | £8,000 – £15,000 | Excavation, sub-base, binder course, surface course |
| Construction (block paving) | £12,000 – £20,000 | As above, plus block paving supply and laying |
| Construction (Quicksetts) | £15,000 – £25,000 | As above, plus Quicksetts panels and installation |
| Construction (hand-laid setts) | £20,000 – £35,000 | As above, plus natural stone setts and specialist labour |
| Tactile paving and kerbs | £1,500 – £3,000 | Dropped kerbs, tactile paving, kerb realignment |
| Signing and marking | £1,000 – £2,000 | Advance warning signs, road markings, posts |
| Landscaping and reinstatement | £1,000 – £3,000 | Verge reinstatement, planting, street furniture |
| **Total (asphalt) | £18,500 – £41,000 | |
| Total (Quicksetts) | £27,500 – £51,000 | |
| Total (hand-laid setts) | £33,500 – £61,000 |
Whole-life costs (20-year appraisal period):
- Asphalt: Capital cost + £500/year maintenance (surface dressing, pothole repairs, remarking) = capital + £10,000.
- Block paving: Capital cost + £300/year maintenance (re-sanding joints, replacing damaged blocks) = capital + £6,000.
- Setts (Quicksetts or hand-laid): Capital cost + £200/year maintenance (re-sanding joints, occasional re-laying) = capital + £4,000.
The higher capital cost of sett paving is partially offset by lower maintenance costs and significantly longer design life, resulting in a lower annualised cost over the long term.
Benefit Quantification
The benefits of speed table schemes are both quantifiable (collision reduction, journey time savings) and qualitative (improved quality of life, increased active travel, enhanced public realm).
Collision cost savings:
Using DfT’s Value of Prevention of Accidents (2023 values):
- Fatal casualty: £2,290,000
- Serious injury: £229,000
- Slight injury: £23,000
A speed table scheme that prevents one serious injury collision over a 20-year period generates a benefit of £229,000. Evidence from DfT’s Traffic Calming Case Studies suggests that speed tables typically reduce injury collisions by 40-60% at the specific location.
Example calculation:
- Baseline: 3 injury collisions (1 serious, 2 slight) in 5 years at the location.
- Expected collisions over 20 years without intervention: 12 collisions (4 serious, 8 slight).
- Expected collisions with speed table (50% reduction): 6 collisions (2 serious, 4 slight).
- Collisions prevented: 6 collisions (2 serious, 4 slight).
- Collision cost saving: (2 x £229,000) + (4 x £23,000) = £458,000 + £92,000 = £550,000.
Journey time savings:
Speed tables typically add 2-3 seconds to vehicle journey times but reduce pedestrian crossing delay by 10-20 seconds (by providing a formal crossing point and reducing vehicle speeds, making gap acceptance easier). For a crossing with 100 pedestrian movements per day:
- Pedestrian time saving: 100 movements x 15 seconds x 365 days x 20 years = 10,950,000 seconds = 3,042 hours.
- Value of time (DfT WebTAG): £6.43/hour (commuting and other travel, 2023 values).
- Pedestrian time saving benefit: 3,042 hours x £6.43 = £19,560.
Health benefits:
Speed reduction and improved pedestrian infrastructure encourage modal shift from car to walking and cycling. DfT’s Active Mode Appraisal Toolkit (AMAT) quantifies health benefits from increased physical activity. A modest increase of 10 additional walking trips per day (e.g., residents choosing to walk to local shops rather than drive) generates:
- Health benefit (AMAT calculation): £15,000 – £30,000 over 20 years (depending on trip length and user demographics).
Total benefits (example scheme):
- Collision cost saving: £550,000
- Pedestrian time saving: £19,560
- Health benefits: £22,500
- Total benefits: £592,060
Benefit-Cost Ratio:
- Scheme cost (Quicksetts): £40,000
- Total benefits: £592,060
- BCR: 14.8
This represents “very high value for money” in DfT terms (BCR > 4.0). Even with more conservative assumptions (e.g., 30% collision reduction, no health benefits), BCRs typically exceed 3.0 for speed tables addressing evidenced collision problems.
Funding Sources
Local authorities face significant budget constraints, making identification of funding sources critical to scheme delivery.
Local Authority capital budgets:
- Highway maintenance budgets: Speed tables can be funded as part of carriageway resurfacing schemes, particularly where the existing surface is life-expired.
- Road safety budgets: Dedicated road safety capital allocations, often prioritised using collision cluster analysis.
- Active travel budgets: Speed tables supporting walking and cycling routes can be funded from active travel capital allocations.
Developer contributions:
- Section 106 agreements: Developers can be required to fund speed tables as part of planning obligations, particularly where new development generates additional traffic or pedestrian movements.
- Community Infrastructure Levy (CIL): CIL receipts can be allocated to traffic calming schemes, subject to the local authority’s CIL spending priorities.
External grants:
- Active Travel England: Capability and Ambition Fund grants support active travel infrastructure, including speed tables on walking and cycling routes.
- Department for Transport: Occasional grant programmes (e.g., Safer Roads Fund, 20mph Fund) support speed reduction schemes.
- Road Safety Trust: Grants for innovative road safety schemes, particularly those addressing vulnerable user safety.
Community funding:
- Parish and town council precepts: Parish councils can allocate precept funding to speed table schemes, often in partnership with the highway authority.
- Crowdfunding: Community crowdfunding campaigns have successfully raised £10,000-£30,000 for speed table schemes in some locations, demonstrating strong local support.
Overcoming Common Challenges
Challenge 1: Emergency Service Objections
Emergency services (fire, ambulance, police) are statutory consultees for traffic calming schemes and frequently object to speed tables on the grounds of response time delays and vehicle wear.
Response strategy:
- Early engagement: Consult emergency services at the design stage, not just during formal TRO consultation. Invite them to review and comment on designs before finalisation.
- Evidence-based discussion: Present evidence that properly designed speed tables (75mm height, 1:15 gradient) cause minimal delay (<5 seconds per table) and that the collision reduction benefits outweigh any marginal response time impact.
- Design modifications: Offer to modify designs to address specific concerns (e.g., increasing plateau length, reducing height to 75mm, ensuring adequate approach visibility).
- Trial installations: Propose a trial period with post-implementation monitoring of emergency service response times, with a commitment to remove the table if significant delays are demonstrated.
In practice, most emergency service objections can be resolved through engagement and design refinement. Fire and ambulance services increasingly recognise that speed tables are preferable to the alternative (continued high collision rates and road closures for collision investigation).
Challenge 2: Noise and Vibration Complaints
Residents adjacent to speed tables sometimes complain of increased noise and vibration, particularly from heavy goods vehicles traversing the ramps.
Response strategy:
- Design for low impact: Specify 75mm height (not 100mm), 1:15 gradients (not 1:10), and high-quality materials (block paving or Quicksetts rather than asphalt) to minimise impact.
- Pre-implementation noise survey: Conduct a baseline noise survey before construction, establishing existing noise levels. Commit to post-implementation monitoring and remedial action if noise levels increase significantly.
- Material selection: Avoid loose-laid materials (e.g., cobbles with wide joints) that can generate excessive noise. Specify fine sand jointing or resin-bound jointing for sett paving.
- HGV restrictions: Consider complementary measures such as weight restrictions or HGV routing strategies to reduce heavy vehicle volumes on the street.
Evidence from post-implementation studies suggests that noise complaints are most common in the first few weeks after installation (when the feature is novel and residents are sensitised to it) and typically decline over time as residents habituate.
Challenge 3: Traffic Displacement
Opponents of speed tables often argue that they will displace traffic to parallel residential streets, simply moving the problem rather than solving it.
Response strategy:
- Area-wide approach: Implement speed tables as part of an area-wide 20mph zone or Low Traffic Neighbourhood, rather than as isolated interventions. This prevents displacement by treating all streets equally.
- Traffic volume monitoring: Conduct before-and-after traffic counts on parallel streets to demonstrate whether displacement occurs. Evidence suggests that well-designed traffic calming typically reduces overall traffic volumes (by making walking and cycling more attractive) rather than displacing them.
- Complementary measures: Combine speed tables with modal filters, one-way systems, or parking controls to prevent rat-running on parallel streets.
Challenge 4: Cost and Budget Constraints
The cost of speed table schemes, particularly those using high-quality materials, can be prohibitive for budget-constrained local authorities.
Response strategy:
- Phased implementation: Implement schemes in phases, starting with the highest-priority locations (e.g., school crossings, collision clusters) and extending to lower-priority locations as funding becomes available.
- Value engineering: Explore cost-saving options such as asphalt construction for the ramps with block paving only on the plateau, or Quicksetts (which reduce traffic management costs) rather than hand-laid setts.
- Partnership funding: Seek contributions from parish councils, developers, or community groups to supplement local authority budgets.
- Whole-life cost analysis: Present whole-life cost comparisons demonstrating that higher-quality materials (setts, Quicksetts) have lower annualised costs than asphalt due to longer design life and lower maintenance costs.
8. The Future of Speed Management: Integration and Innovation
Speed tables are not a static technology but an evolving component of the urban design and transport management toolkit. Emerging trends and innovations are expanding their functionality and integration with broader transport and urban systems.
Low Traffic Neighbourhoods and 15-Minute Cities
The Low Traffic Neighbourhood (LTN) concept—restricting through motor traffic in residential areas whilst maintaining access for residents, deliveries, and emergency services—has gained significant traction in UK cities since 2020. Speed tables play a critical role in LTN design as nodal points that:
- Reinforce filtered permeability: Speed tables at the entry to filtered streets (streets closed to through traffic by modal filters) create a physical and psychological threshold, signalling the change in street character.
- Facilitate pedestrian and cycle priority: By reducing vehicle speeds to 10-15mph, speed tables create a shared space environment where pedestrians and cyclists have de facto priority.
- Provide crossing points: In LTNs with reduced traffic volumes but retained vehicle access, speed tables provide safe crossing points without the need for signal-controlled crossings.
The 15-Minute City concept—ensuring that residents can access essential services (shops, schools, healthcare, green space) within a 15-minute walk or cycle—similarly relies on speed tables to create safe, attractive walking and cycling routes. Speed tables on key desire lines (e.g., routes from residential areas to local centres) remove barriers to active travel and support modal shift.
Smart Integration: Sensors and Data Collection
The physical structure of a speed table provides an opportunity to embed sensors and data collection infrastructure:
- Vehicle counters: Inductive loops or piezoelectric sensors embedded in the plateau surface can collect continuous traffic count data, providing real-time monitoring of traffic volumes and speeds.
- Air quality sensors: Compact air quality sensors (measuring NO₂, PM2.5, PM10) can be mounted on speed table signage or street furniture, providing hyperlocal air quality data to inform Low Emission Zone policies and public health interventions.
- Pedestrian counters: Infrared or video-based pedestrian counters can monitor crossing volumes, providing data to justify investment and demonstrate scheme effectiveness.
- Smart lighting: LED street lighting integrated with the speed table can be programmed to increase illumination when pedestrians are detected, improving safety whilst reducing energy consumption.
This “smart speed table” concept transforms a passive physical intervention into an active data collection and management node, supporting evidence-based transport planning and real-time network management.
Connected and Autonomous Vehicles (CAVs)
The advent of Connected and Autonomous Vehicles (CAVs) raises questions about the future relevance of physical traffic calming measures. If vehicles are controlled by algorithms that strictly observe speed limits, do we still need speed tables?
The answer is yes, for several reasons:
- Mixed fleet transition: The transition to full CAV adoption will take decades, during which conventional vehicles and CAVs will share the road network. Speed tables remain necessary to manage conventional vehicle speeds.
- Pedestrian priority: Even in a fully autonomous future, speed tables serve a pedestrian priority function, creating level crossing surfaces and signalling to CAVs (via digital mapping) that pedestrians have priority.
- Fail-safe design: Physical infrastructure provides a fail-safe in the event of CAV system failures, ensuring that vehicles cannot exceed safe speeds even if autonomous systems malfunction.
- Standardised geometry: Speed tables provide standardised, predictable vertical geometry that CAV systems can easily detect and respond to, unlike more complex traffic calming measures (chicanes, pinch points) that require sophisticated object recognition.
Future CAV systems will likely incorporate speed table locations into high-definition digital maps, using the physical geometry as a digital signal to reduce speed and yield to pedestrians. Far from becoming obsolete, speed tables may become more important as a standardised, machine-readable element of the road environment.
Modular and Temporary Installations
Emerging technologies are enabling temporary and modular speed table installations, allowing local authorities to trial schemes before committing to permanent construction:
- Rubber speed tables: Prefabricated rubber modules that can be bolted to the carriageway surface, creating a temporary speed table without excavation or permanent alteration. Suitable for trial schemes, temporary events, or locations where permanent construction is not feasible (e.g., private roads, temporary diversions).
- Modular concrete units: Interlocking precast concrete units that can be installed and removed without specialist equipment, allowing seasonal installation (e.g., during school terms only) or trial periods.
- Inflatable speed tables: Experimental systems using inflatable bladders that can be deployed and removed rapidly, though durability and puncture resistance remain challenges.
Temporary installations allow local authorities to test community acceptance, measure effectiveness, and refine designs before committing to permanent construction, reducing the risk of costly mistakes or contentious schemes.
Climate Adaptation and Sustainable Drainage
Climate change is increasing the frequency and intensity of extreme rainfall events, placing greater demands on urban drainage systems. Speed tables can be designed to contribute to sustainable drainage (SuDS) objectives:
- Permeable paving: Specifying permeable block paving or permeable concrete for the plateau surface allows rainwater to infiltrate, reducing surface water runoff and flood risk.
- Integrated rain gardens: Incorporating planted rain gardens or bioswales at the edges of the speed table plateau, capturing and treating surface water runoff whilst enhancing biodiversity and visual amenity.
- Blue-green infrastructure: Combining speed tables with street trees, planting beds, and water features to create multifunctional public realm that manages water, reduces urban heat island effects, and enhances ecological value.
This integrated approach positions speed tables not as isolated traffic engineering interventions but as components of holistic, climate-resilient urban design.
Outcomes:
* 85th percentile speed reduced from 38mph to 24mph (36% reduction).
* Resident satisfaction survey: 87% of respondents rated the scheme as “good” or “excellent” for visual appearance, compared to 23% for the previous asphalt hump.
* The speed table became a focal point for community events, with the plateau used for a weekly farmers’ market and seasonal festivals.
* The scheme won a regional CIHT award for Excellence in Highway Maintenance and Management.
This example shows that aesthetics are not a luxury, but a key determinant of scheme success, both in terms of functional outcomes (speed reduction) and community acceptance.
Conclusion: Speed tables – so much more than a bump in the road
In conclusion, speed tables should not be considered merely a design solution or traffic calming measure that can be disruptive or an obstruction that users must work their way around. Done properly they are a public realm investment that can serve two of the most pressing and urgent requirements of 21st century UK street design – slowing speeds, and putting people first.
In this guide we have shown that speed tables are an integral and important part of the traffic calming hierarchy of measures; with their key design feature of the raised flat-topped hump that slows traffic, and elevates the pedestrian crossing plane at the same time, can provide a solution that can be greater than the sum of its parts in comparison to a standalone hump or junction treatment. This is not a happy coincidence, rather, it is deliberate and entirely in line with the Vision Zero and Safe Systems approach that is now informing UK transport policy and planning.
The legal and policy landscape is clear. The legal framework of the Highways Act 1980 and the Traffic Calming Act 1992, together with the Department for Transport’s technical guidance in the form of Local Transport Note 1/07, and the continued drive by UK local authorities to implement 20mph zones, Low Traffic Neighbourhoods, and 15-Minute City planning concepts and masterplans, all signal a policy consensus that speed management is an indivisible component of the liveable, equitable, and inclusive streets that we should all be striving to create. Speed tables, when used as part of these wider schemes, can provide key safety and accessibility nodes in the street network, where the primary purpose of the street is shifted in favour of pedestrians and cyclists.
In terms of the business case for investment in speed tables, the arguments stack up too. Yes, the upfront capital cost of design, statutory consultation, and construction are real. But the long-term benefits in terms of preventing collisions and reducing the severity of injuries, improving public health outcomes, and, crucially, improving the perceived safety of a community, will often more than repay the initial outlay many times over. Section 106 contributions, local authority budgets, and Active Travel England funding, to name just a few, all reflect a growing understanding of this value for money.
Above all else, we have presented in this article a robust and defensible process to follow when designing, securing approval for, and constructing speed tables, including the all-important post-construction monitoring and evaluation. By following the logical stages set out above, which use LTN 1/07 as a reference point, and bearing in mind the local context and case specificities, risk can be managed and minimised, and positive and lasting results can be achieved.
Speed tables are likely to remain a mainstay of UK streets for the foreseeable future, as our streets adapt to the demands of the climate emergency, public health and wellbeing, and to reclaim space for people and not cars. Predictable, reliable, and fair; speed tables, if specified, designed, and constructed well and correctly, are engineering solutions that can demonstrate tangible safety benefits and a key role to play in the delivery of streets that are safer, more accessible, and more liveable for all. They should not be overlooked by highways engineers and planners serious about committing to a Vision Zero and sustainable urban design agenda.